Fig. 7
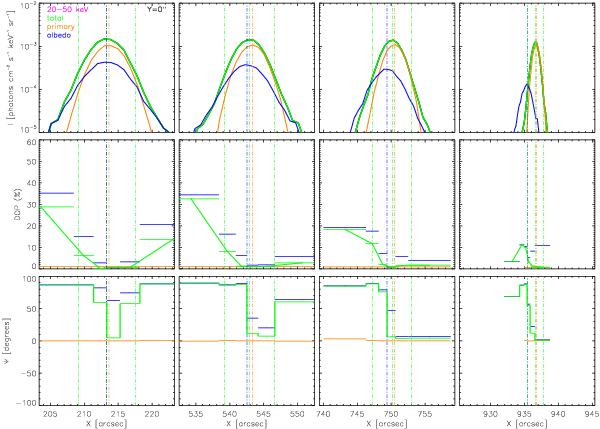
Radial slices through each of the sources in Fig. 6 for the Δν = 4.0 created photon distribution. Each of the radial slices are taken along X at Y = 0′′ for the intensity, I, DOP and polarization angle Ψ at the four source locations. As before, orange = primary, blue = albedo and green = total. The green dash-dot lines denote the centroid position and the FWHM of the total observed source while the orange and blue lines denote the centroid positions of the primary and albedo sources respectively. Slices along the radial direction for the Δν = 4.0 distribution show a clear DOP and Ψ pattern at all four disk locations plotted.
Current usage metrics show cumulative count of Article Views (full-text article views including HTML views, PDF and ePub downloads, according to the available data) and Abstracts Views on Vision4Press platform.
Data correspond to usage on the plateform after 2015. The current usage metrics is available 48-96 hours after online publication and is updated daily on week days.
Initial download of the metrics may take a while.