Fig. 6
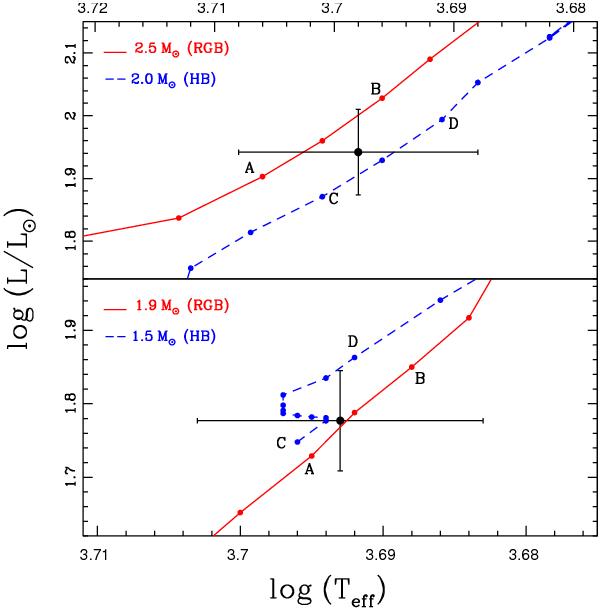
Upper panel: position of HIP 21743 on the HR diagram (black dot). The two closest evolutionary models from Salasnich et al. (2000) are overplotted. The red solid line corresponds to a 2.5 M⊙ RGB model, while the blue dashed line to a 2.0 M⊙ HB model. Both tracks have a metallicity of Z = 0.008. Lower panel: same as the upper plot, but this time the masses of the models are 1.9 M⊙ for an RGB star and 1.5 M⊙ for a HB giant. The position of HIP 68333 is also shown.
Current usage metrics show cumulative count of Article Views (full-text article views including HTML views, PDF and ePub downloads, according to the available data) and Abstracts Views on Vision4Press platform.
Data correspond to usage on the plateform after 2015. The current usage metrics is available 48-96 hours after online publication and is updated daily on week days.
Initial download of the metrics may take a while.