Free Access
Fig. 5
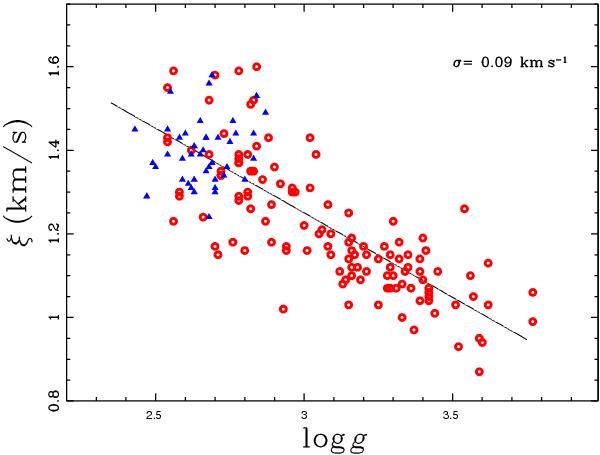
Microturbulent velocity as a function of photometric log g. The red open circles correspond to RGB stars and the blue filled triangles correspond to HB stars. A linear regression yields a fit of ξ = 2.55−0.45 log g, with a scatter of 0.09 km s-1.
Current usage metrics show cumulative count of Article Views (full-text article views including HTML views, PDF and ePub downloads, according to the available data) and Abstracts Views on Vision4Press platform.
Data correspond to usage on the plateform after 2015. The current usage metrics is available 48-96 hours after online publication and is updated daily on week days.
Initial download of the metrics may take a while.