Fig. 1
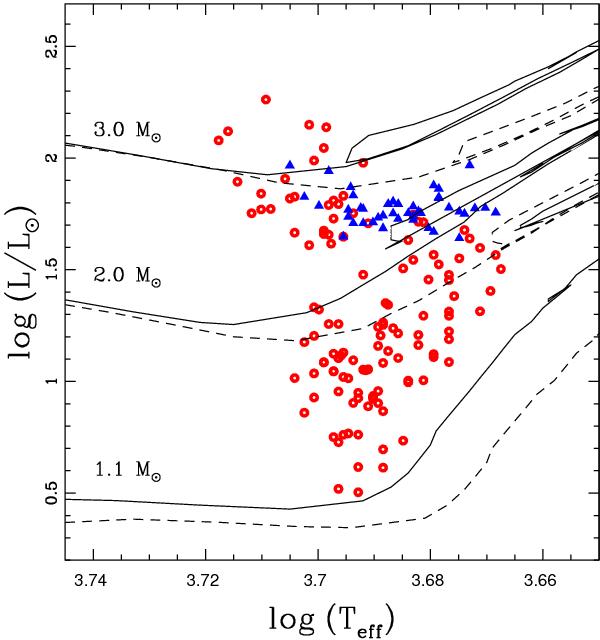
HR diagram including all of our targets. The red open circles correspond to RGB stars, while the blue filled triangles to HB stars. Different evolutionary tracks (Salasnich et al. 2000) are overplotted for stars with 1.1 M⊙, 2.0 M⊙ and 3.0 M⊙ (line pairs from bottom to top). The solid lines correspond to models with [Fe/H] = 0.0 and the dashed lines to [Fe/H] = 0.32.
Current usage metrics show cumulative count of Article Views (full-text article views including HTML views, PDF and ePub downloads, according to the available data) and Abstracts Views on Vision4Press platform.
Data correspond to usage on the plateform after 2015. The current usage metrics is available 48-96 hours after online publication and is updated daily on week days.
Initial download of the metrics may take a while.