Fig. 4
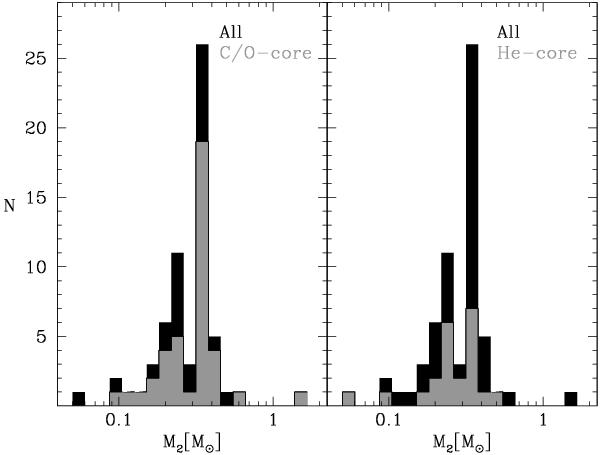
Distribution of secondary star masses. As in Fig. 1 systems containing C/O-core WDs (left) and He-core WDs (right) are shown in gray, while black distributions represent the entire PCEB population. A χ2 test provides Q(χ2) = 0.59 which implies that our data does not contain indications for the two distributions in gray to be drawn from different parent distributions.
Current usage metrics show cumulative count of Article Views (full-text article views including HTML views, PDF and ePub downloads, according to the available data) and Abstracts Views on Vision4Press platform.
Data correspond to usage on the plateform after 2015. The current usage metrics is available 48-96 hours after online publication and is updated daily on week days.
Initial download of the metrics may take a while.