Fig. 3
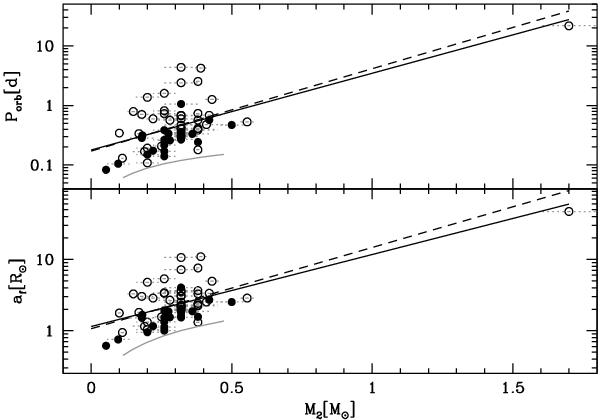
Post-CE orbital period (top) and binary separation (bottom) as a function of secondary mass for the sample of 62 PCEBs. Symbols are the same as in Fig. 2. The solid and dashed lines correspond to the best linear fit for the 62 systems and for the 60 systems with 0.08 M⊙ ≤ M2 ≤ 1.0 M⊙ (excluding the PCEBs with the highest and lowest secondary masses), respectively, while the gray line corresponds to the CV birthline based on the mass-radius relation given in Rebassa-Mansergas et al. (2007).
Current usage metrics show cumulative count of Article Views (full-text article views including HTML views, PDF and ePub downloads, according to the available data) and Abstracts Views on Vision4Press platform.
Data correspond to usage on the plateform after 2015. The current usage metrics is available 48-96 hours after online publication and is updated daily on week days.
Initial download of the metrics may take a while.