Fig. 7
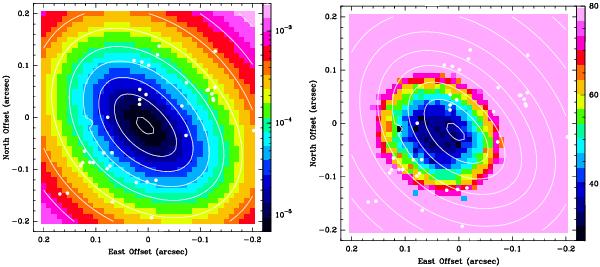
Maps of the (mean squared) residual (left panel) and best-fit central mass (right panel) obtained by fitting the curve  to the 6.7 GHz maser data in G16.59 − 0.05. Colours give the map value, with the value-color conversion code given in the wedge on the right side of the panels. The values reported in the wedge are in units of arcsec6 and solar mass (M⊙) for the left and right panels, respectively. In both panels, positions are given relative to the center of motion of the 6.7 GHz masers (as defined in SMC1). To better compare the two maps, in both panels white contours report the same levels of fit (mean squared) residual. The plotted levels are from 7 × 10⁻⁶ arcsec6 (10% higher than the minimum fit residual) to 1.6 × 10⁻³ arcsec6, stepped by a factor of 2. The spatial distribution of the 6.7 GHz maser features is indicated with white dots.
Current usage metrics show cumulative count of Article Views (full-text article views including HTML views, PDF and ePub downloads, according to the available data) and Abstracts Views on Vision4Press platform.
Data correspond to usage on the plateform after 2015. The current usage metrics is available 48-96 hours after online publication and is updated daily on week days.
Initial download of the metrics may take a while.