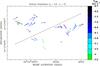
Fig. 5
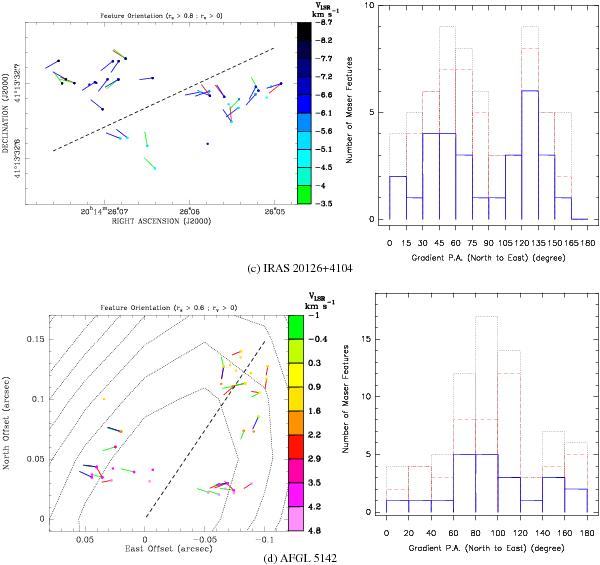
continued. The panels in each row present the spatial distribution and the histogram of the VLSR gradient directions for the maser source indicated below the panels. Left panel: spatial distribution of the VLSR gradient directions. Colored dots and colored segments have the same meaning as in Figs. 5a and b. For the source IRAS 20126 + 4104, absolute maser positions are reported, relative to the observing epoch 2004 November 6 (MCR, Fig. 2). In the source AFGL 5142, feature positions are relative to the peak of the VLA 1.3 cm continuum observed toward the 6.7 GHz masers (Goddi et al. 2007, see Fig. 2), whose contour map is shown by a dotted line. In both the plots of IRAS 20126 + 4104 and AFGL 5142, the dashed line gives the direction of the collimated jet traced close to the (proto)star by the 22 GHz water masers. The plot reports only the feature gradients with better defined directions, corresponding to more linear spot distributions and higher values of the correlation coefficient, rs: rs > 0.8 for IRAS 20126 + 4104, and rs > 0.6 for AFGL 5142. Right panel: histograms of the PA of the feature gradient directions. Dotted black, dashed red, and continuous blue lines have the same meaning as in Figs. 5a and 5b. The histogram bin size is 15° for the source IRAS 20126 + 4104, and 20° for the source AFGL 5142.
Current usage metrics show cumulative count of Article Views (full-text article views including HTML views, PDF and ePub downloads, according to the available data) and Abstracts Views on Vision4Press platform.
Data correspond to usage on the plateform after 2015. The current usage metrics is available 48-96 hours after online publication and is updated daily on week days.
Initial download of the metrics may take a while.