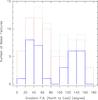
Fig. 5
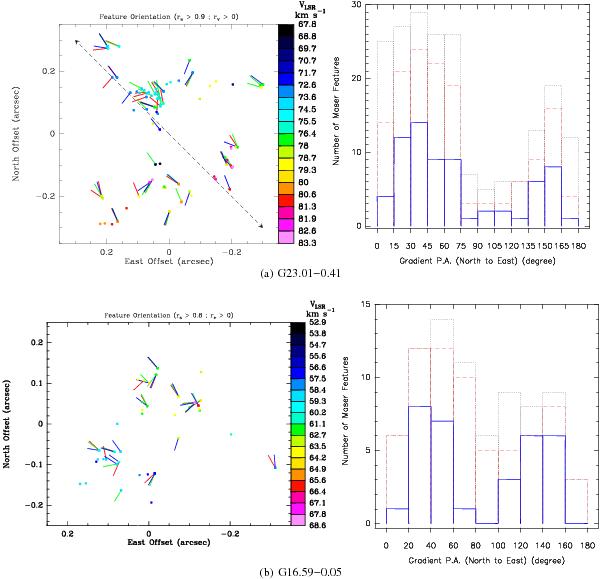
The panels in each row present the spatial distribution and the histogram of the VLSR gradient directions for the maser source indicated below the panels. Left panel: spatial distribution of the VLSR gradient directions. Colored dots report the position of the maser features detected over the three observing epochs, with colors indicating the feature VLSR. The velocity-color conversion code is shown in the wedge on the right side of the panel, with green denoting the systemic VLSR of the maser source. Colored segments associated to maser features give the direction of the feature VLSR gradient (with PA varying in the range 0°–180°), with different colors to distinguish the observing epoch: red, green, and blue, for the first, second, and third epochs, respectively. The segment length is proportional to the value of the correlation coefficient, rs, of the linear fit to the spot positions, from which the gradient direction is derived. The plot reports only the feature gradients with better defined directions, corresponding to more linear spot distributions and higher values of the correlation coefficient, rs: rs > 0.9 for G23.01 − 0.41, and rs > 0.8 for G16.59−0.05. For the sources G16.59−0.05 and G23.01 − 0.41, feature positions are relative to the maser’s “center of motion”, as defined in SMC1 and SMC2, respectively. In the plot of G23.01−0.41, the dashed arrow indicates the direction of the collimated jet traced close to the (proto)star by the 22 GHz water masers (SMC2). Right panel: histograms of the PA of the feature gradient directions. Dotted black, dashed red, and continuous blue lines show the histograms of the gradient PA for features with increasingly better linear structure, corresponding to values of the correlation coefficient rs > 0, rs > 0.5, and rs > 0.9, respectively. The histogram bin size is 15° for the source G23.01−0.41, and 20° for the source G16.59−0.05.
Current usage metrics show cumulative count of Article Views (full-text article views including HTML views, PDF and ePub downloads, according to the available data) and Abstracts Views on Vision4Press platform.
Data correspond to usage on the plateform after 2015. The current usage metrics is available 48-96 hours after online publication and is updated daily on week days.
Initial download of the metrics may take a while.