Fig. 4
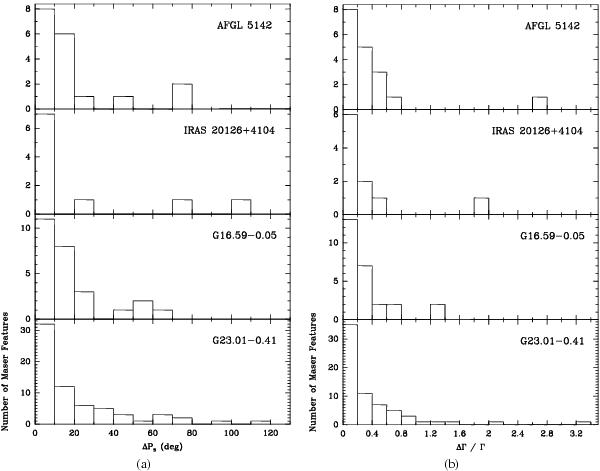
Time variation in VLSR gradient PA and amplitude. a) Each of the four panels refers to the maser source indicated in the upper right corner of the panel, and presents the histogram of the standard deviation (ΔPs) of the values of the gradient PA, at different epochs, for features persisting over two or three observing epochs. The bin size of all the histograms is 10°. b) Each of the four panels refers to the maser source indicated in the upper right corner of the panel, and presents the histogram of the fractional time variation (ΔΓ/Γ) in the gradient amplitude, for features persisting over two or three observing epochs. The bin size of all the histograms is 0.2.
Current usage metrics show cumulative count of Article Views (full-text article views including HTML views, PDF and ePub downloads, according to the available data) and Abstracts Views on Vision4Press platform.
Data correspond to usage on the plateform after 2015. The current usage metrics is available 48-96 hours after online publication and is updated daily on week days.
Initial download of the metrics may take a while.