Fig. 1
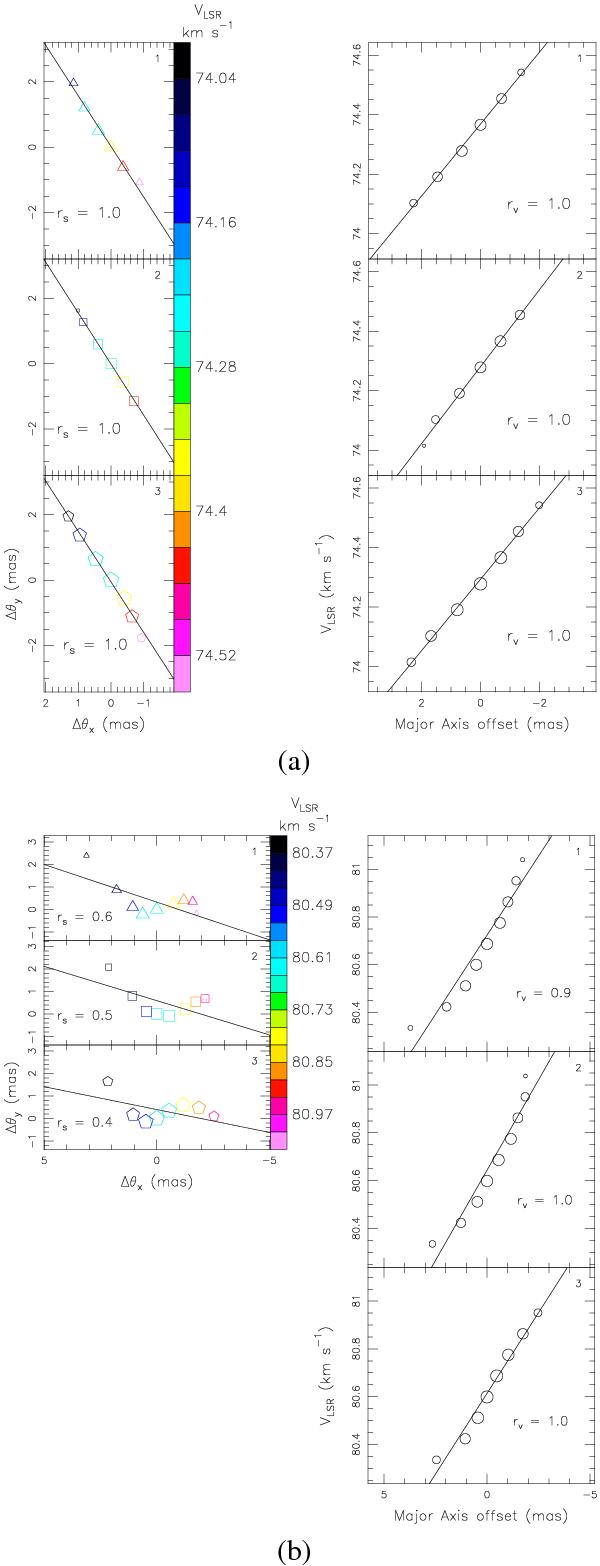
Examples of two 6.7 GHz maser features with ordered spatial and VLSR distribution. a) The upper, middle, and lower panels refer to measurements at the first, second, and third observing epochs, respectively. Left panels: spot spatial distribution. Triangles, squares, and pentagons indicate the spot positions on the plane of the sky at the first, second, and third epochs, respectively, with symbol size varying logarithmically with the spot intensity. The symbol color indicates the spot VLSR, with the color-velocity conversion code given in the wedge on the right side of the three panels. At each epoch, the positions of the spots are relative to that of the epoch’s most intense spot. In each of the three panels, the continuous line shows the (minimum χ2) linear fit to the spot positions, defining the direction of the major axis of the spot distribution. The lower left corner of each panel reports the value of the linear correlation coefficient, rs. Right panels: spot VLSR-position distribution. In each of the three panels, empty circles show the plot of spot VLSR versus the position offset along the major axis of the spot distribution. Position offsets are taken as positive if increasing towards the east. Circle size varies logarithmically with the spot intensity. The continuous lines show the (minimum χ2) linear fit to the circle distribution. The lower right corner of each panel reports the value of the linear correlation coefficient, rv. b) Same as for a) for another feature of our sample.
Current usage metrics show cumulative count of Article Views (full-text article views including HTML views, PDF and ePub downloads, according to the available data) and Abstracts Views on Vision4Press platform.
Data correspond to usage on the plateform after 2015. The current usage metrics is available 48-96 hours after online publication and is updated daily on week days.
Initial download of the metrics may take a while.