Fig. 1
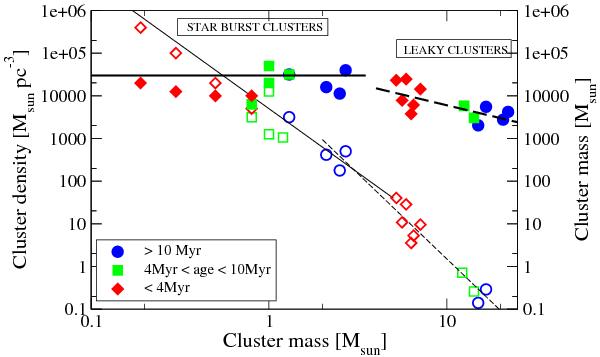
Cluster mass as a function of cluster size (full symbols) for exposed clusters more massive than 103 M⊙. The diamond symbols represent clusters younger than 4 Myr, the squares clusters in the age range 4 Myr < tc < 10 Myr, and the circles clusters with ages 10 Myr < tc < 20 Myr. The thick line shows that the cluster mass remains more or less constant for the starburst cluster sequence, whereas the leaky cluster mass rapidly declines with cluster age (thick dashed line). The values were taken from Figer (2008), Wolff et al. (2007), and Borissova et al. (2008). In addition, the relation between the cluster density and cluster radius are shown by empty symbols as in Pfalzner (2009).
Current usage metrics show cumulative count of Article Views (full-text article views including HTML views, PDF and ePub downloads, according to the available data) and Abstracts Views on Vision4Press platform.
Data correspond to usage on the plateform after 2015. The current usage metrics is available 48-96 hours after online publication and is updated daily on week days.
Initial download of the metrics may take a while.