Fig. 5
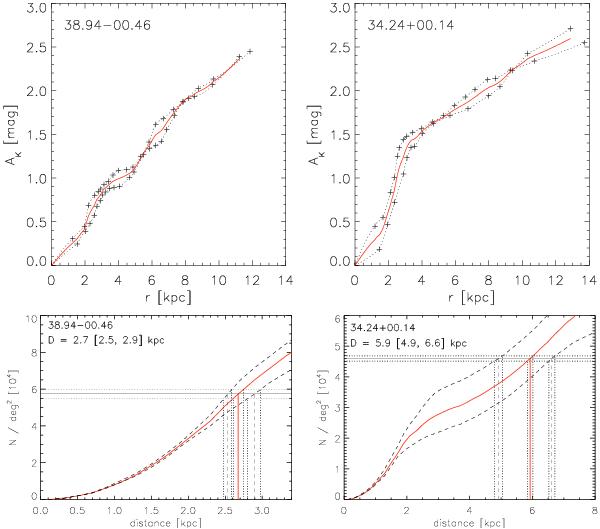
Top row: radial dust extinction profiles constructed for two complexes. The plus-signs and the dotted lines show the extinction profiles adopted from Marshall et al. (2006). The solid red line shows the mean profile. Bottom row: predicted source count functions (source count above the limiting magnitude Klim), based on the Besançon model and Marshall et al. (2006) reddening data, for the same two clouds. The source count functions corresponding to the mean extinction profile are shown with the solid red curves. The dashed black curves show the same function using the individual extinction profiles. The horizontal lines show the observed foreground source density, and the vertical lines point out the corresponding distances. The dotted lines show the Poisson errors related to the observed source density (and the resulting distances).
Current usage metrics show cumulative count of Article Views (full-text article views including HTML views, PDF and ePub downloads, according to the available data) and Abstracts Views on Vision4Press platform.
Data correspond to usage on the plateform after 2015. The current usage metrics is available 48-96 hours after online publication and is updated daily on week days.
Initial download of the metrics may take a while.