Fig. 4
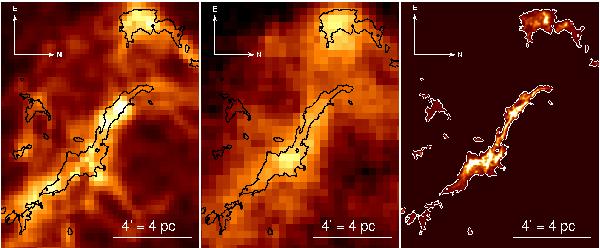
Close-up of a few IRDCs in the 35.49-00.31 complex (see Fig. A.2 for the map of the entire complex). Left: near-infrared dust extinction map. The color scale is linear and spans AV = 3 − 30 mag. The contour shows the detection threshold of the 8 μm opacity data (see the right panel). Center: integrated intensity of the 13CO molecule in the velocity interval 24.6–46.9 km s-1. Right: 8 μm optical depth map. The white contour is drawn at τ(8 μm) = 0.3, or AV ≈ 6.3 mag, representing the detection threshold of the data (Peretto & Fuller 2009). The color scale is linear with the maximum of AV = 90 mag.
Current usage metrics show cumulative count of Article Views (full-text article views including HTML views, PDF and ePub downloads, according to the available data) and Abstracts Views on Vision4Press platform.
Data correspond to usage on the plateform after 2015. The current usage metrics is available 48-96 hours after online publication and is updated daily on week days.
Initial download of the metrics may take a while.