Fig. 3
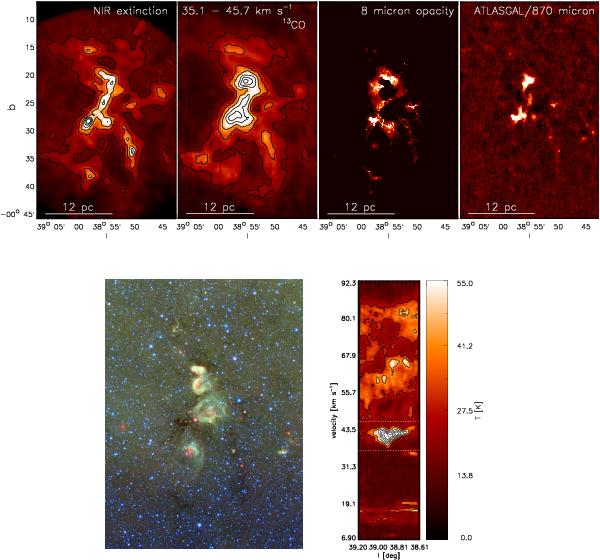
Infrared dark cloud complex 38.94-00.46 at the distance of Dfg = 2.7 kpc (estimated from foreground source density, see Sect. 3). Top row: the first panel shows NIR dust extinction map, derived using JHKS data from the UKIDSS Galactic Plane Survey. The resolution of the map is 30″ and contours starting from AV = 3 mag in steps of 4 mag are shown. The second panel shows the integrated intensity of the 13CO molecule from the GRS survey data. The contours start from 15 K km s-1 and the step is 15 K km s-1. The velocity region included in this map is 35.1–45.7 km s-1. The third panel shows an 8 μm optical depth map of the complex, constructed from the opacity maps of ~ 20 individual IRDCs identified in this region by Peretto & Fuller (2009). The color scale is linear, starts from AV ≈ 10 mag, and the maximum is AV ≈ 90 mag. The fourth panel shows the 870 μm dust emission from the region mapped by the ATLASGAL survey (Schuller et al. 2009). The color scale is linear and starts at AV ≈ 3.6 mag, and the maximum is AV ≈ 43 mag. Lower left: Spitzer/GLIMPSE/MIPSGAL three-color image of the complex, showing 4.5, 8, and 24 μm data in blue, green, and red, respectively. Lower right: position-velocity diagram of the region, integrated over − 00°45′ < b < 0°. The velocity interval chosen to represent the complex is indicated with dotted white lines.
Current usage metrics show cumulative count of Article Views (full-text article views including HTML views, PDF and ePub downloads, according to the available data) and Abstracts Views on Vision4Press platform.
Data correspond to usage on the plateform after 2015. The current usage metrics is available 48-96 hours after online publication and is updated daily on week days.
Initial download of the metrics may take a while.