Fig. 2
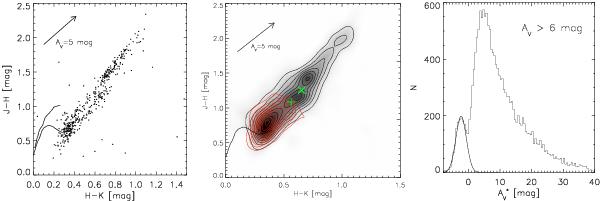
Left: color–color diagram of the sources in the control field chosen for the 38.94-00.46 complex with photometric error σ < 0.03 mag. Extinction of AV = 5 mag is indicated with an arrow. Center: the same for all sources in the control field, shown with a grayscale (and black contours) that indicates the density of points. The mean colors of these sources are marked with a green plus-sign. The red contours show the density of the sources that are in the foreground of the 38.94-00.46 complex. The contribution of these sources to the mean color is statistically subtracted from the mean, resulting in the mean color of the background sources, which is shown with a green cross. Right: frequency distribution of the extinction measurements toward individual sources ( ) in a region where AV > 6 mag. The small bump at slightly negative extinction values is produced by the foreground stars that are removed during the last step of the extinction mapping procedure (see Sect. 2.2). The surface density of the foreground sources identified in this way is also used in estimating the distances to the cloud complexes in Sect. 3.
Current usage metrics show cumulative count of Article Views (full-text article views including HTML views, PDF and ePub downloads, according to the available data) and Abstracts Views on Vision4Press platform.
Data correspond to usage on the plateform after 2015. The current usage metrics is available 48-96 hours after online publication and is updated daily on week days.
Initial download of the metrics may take a while.