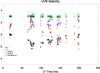
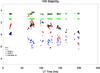
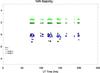
Fig. 12

Stability of the UVB (top), VIS (center) and NIR (bottom) spectrographs over 6 consecutive nights as measured during the third commissioning run. The dark and light green points show the FWHM in X and Y of a 0.5′′ pinhole, the black and blue points show the X and Y position of a reference calibration line with respect to its position measured at zenith on the first day and the red points show the ambient temperature (for UVB and VIS only since it is irrelevant for the temperature controlled NIR arm).
Current usage metrics show cumulative count of Article Views (full-text article views including HTML views, PDF and ePub downloads, according to the available data) and Abstracts Views on Vision4Press platform.
Data correspond to usage on the plateform after 2015. The current usage metrics is available 48-96 hours after online publication and is updated daily on week days.
Initial download of the metrics may take a while.