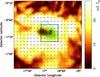
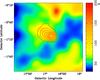
Fig. 4
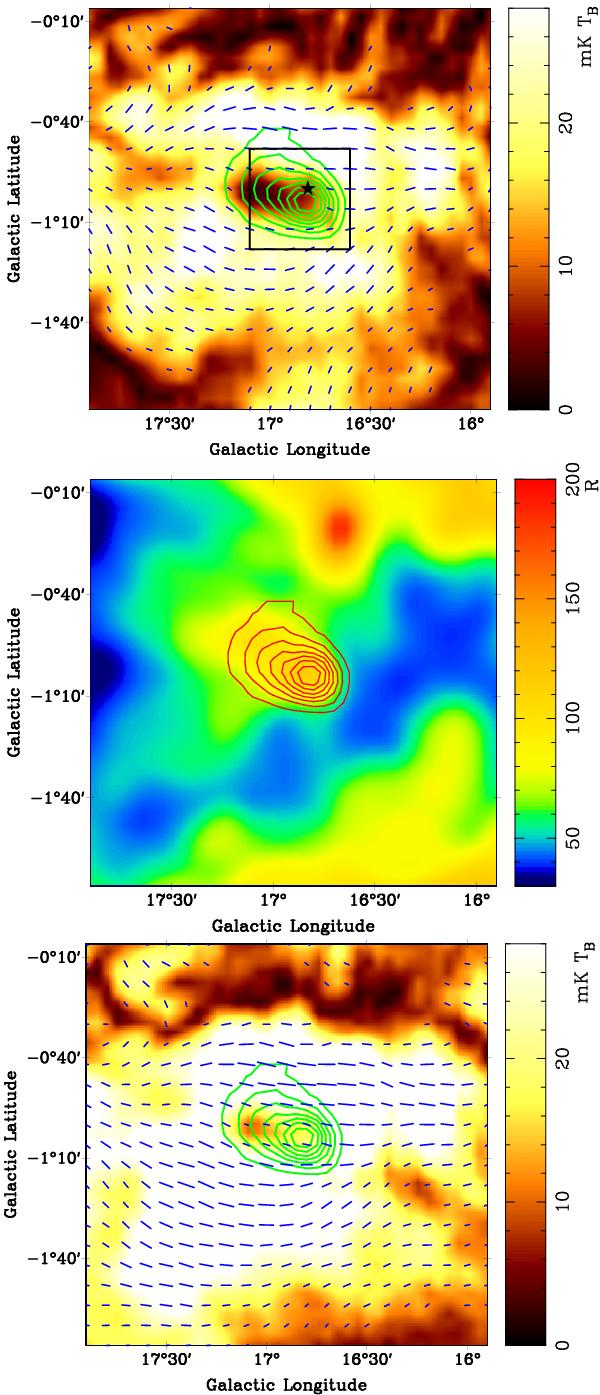
Images of G16.8−1.1. The contours display the total intensity at λ6 cm, starting at 50 mK TB and running in steps of 50 mK TB. The image shows the observed λ6 cm polarization intensity in the top panel, the Hα intensity in the middle panel, and the absolutely calibrated λ6 cm polarization intensity in the bottom panel. The bars indicate B-vectors with their lengths proportional to polarized intensity with a low intensity cutoff of 1 mK TB. The box indicates the mapped region by Reich et al. (1986). The star indicates the position of the pulsar PSR B1822−14.
Current usage metrics show cumulative count of Article Views (full-text article views including HTML views, PDF and ePub downloads, according to the available data) and Abstracts Views on Vision4Press platform.
Data correspond to usage on the plateform after 2015. The current usage metrics is available 48-96 hours after online publication and is updated daily on week days.
Initial download of the metrics may take a while.