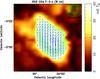
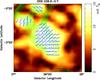
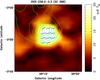
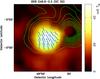
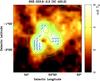
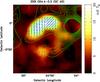
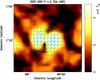
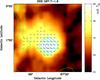
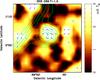
Fig. 3
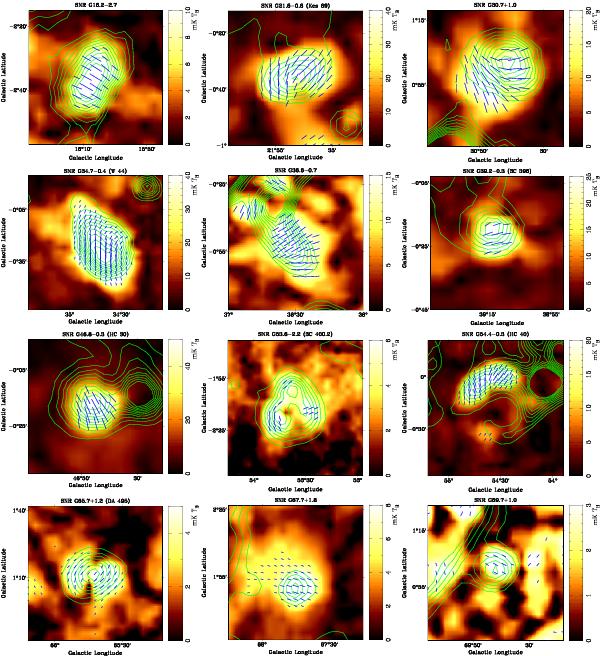
λ6 cm images of SNRs. Polarized intensity is encoded in images, while contours show total intensities. Bars indicate B-vectors (observed E-vectors + 90°). The starting levels and the contour step intervals (both in mK TB) are for G16.2−2.7: 20 and 6, for G21.8−0.6: 800 and 250, for G30.7 + 1.0: 10 and 15, for G34.7−0.4: 500 and 300, for G36.6−0.7: 20 and 10, for G39.2−0.3: 250 and 150, for G46.8−0.3: 50 and 50, for G53.6−2.2: 6 and 15, for G54.4−0.3: 50 and 20, for G65.7+1.2: 30 and 15, for G67.7+1.8: 5 and 8, and for G69.7+1.0: 30 and 8.
Current usage metrics show cumulative count of Article Views (full-text article views including HTML views, PDF and ePub downloads, according to the available data) and Abstracts Views on Vision4Press platform.
Data correspond to usage on the plateform after 2015. The current usage metrics is available 48-96 hours after online publication and is updated daily on week days.
Initial download of the metrics may take a while.