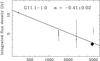
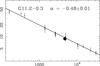
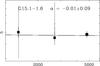
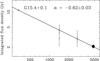
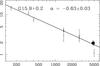
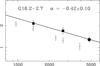
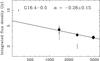
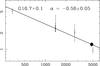
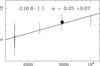
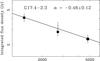
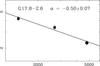
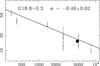
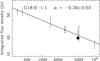
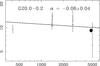
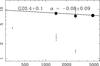
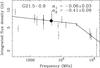
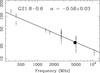
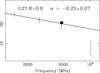
Fig. 1
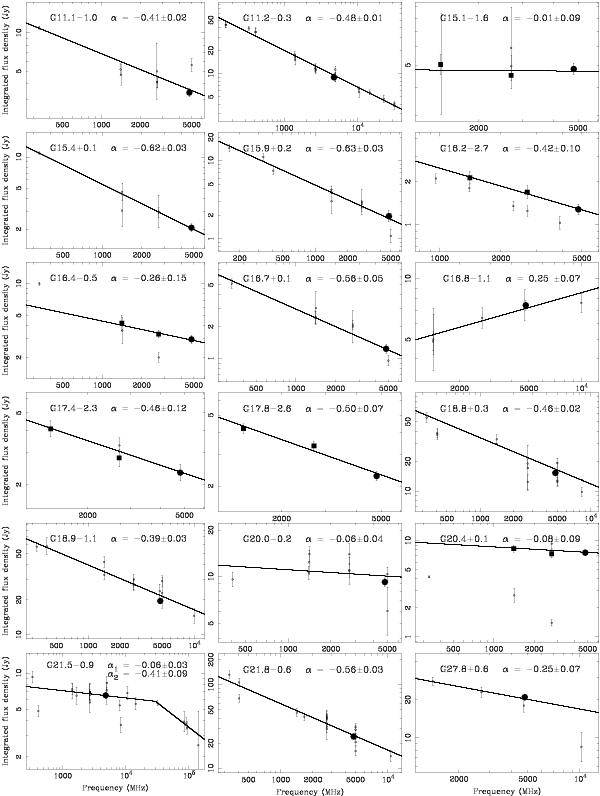
Spectra for 50 SNRs. The present λ6 cm flux densities are indicated by black dots, while the flux densities we derived from the λ11 cm and λ21 cm Effelsberg surveys are marked by dark squares. Other measurements were taken from the references listed in Table 1.
Current usage metrics show cumulative count of Article Views (full-text article views including HTML views, PDF and ePub downloads, according to the available data) and Abstracts Views on Vision4Press platform.
Data correspond to usage on the plateform after 2015. The current usage metrics is available 48-96 hours after online publication and is updated daily on week days.
Initial download of the metrics may take a while.