Fig. 8
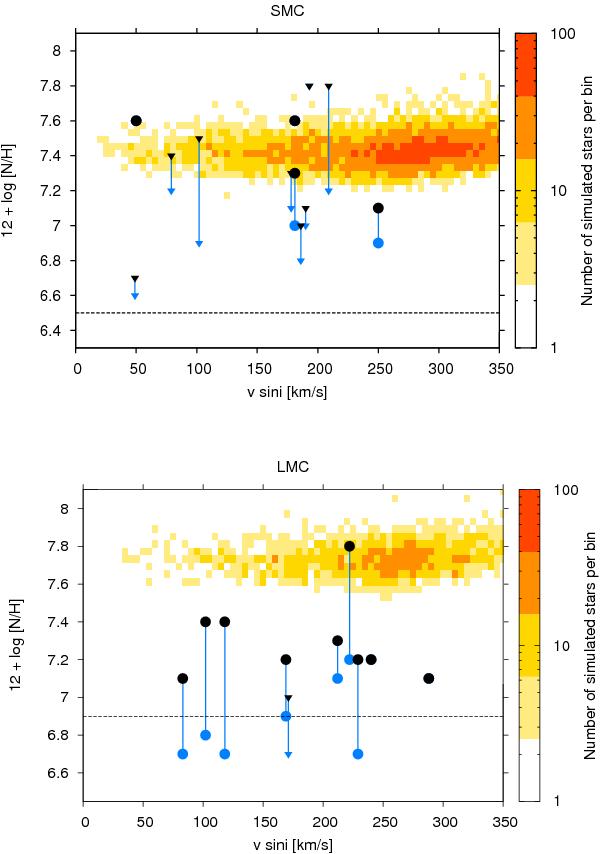
Estimated nitrogen abundances and projected rotational velocities plotted for the SMC (top panel) and LMC (bottom panel) Be-type stellar samples before and after contamination correction (blue and black respectively). Simulations are based on the rotational velocity distribution of Hunter et al. with only B-type stars rotating with critical velocity between 65% and 75% as to represent a sample of stars rotating around 70% of critical velocity. Marked on each plot as a black dashed line is the baseline nitrogen abundance. Simulations predict too high nitrogen abundances for the LMC, with a mixed view given for the SMC.
Current usage metrics show cumulative count of Article Views (full-text article views including HTML views, PDF and ePub downloads, according to the available data) and Abstracts Views on Vision4Press platform.
Data correspond to usage on the plateform after 2015. The current usage metrics is available 48-96 hours after online publication and is updated daily on week days.
Initial download of the metrics may take a while.