Fig. 5
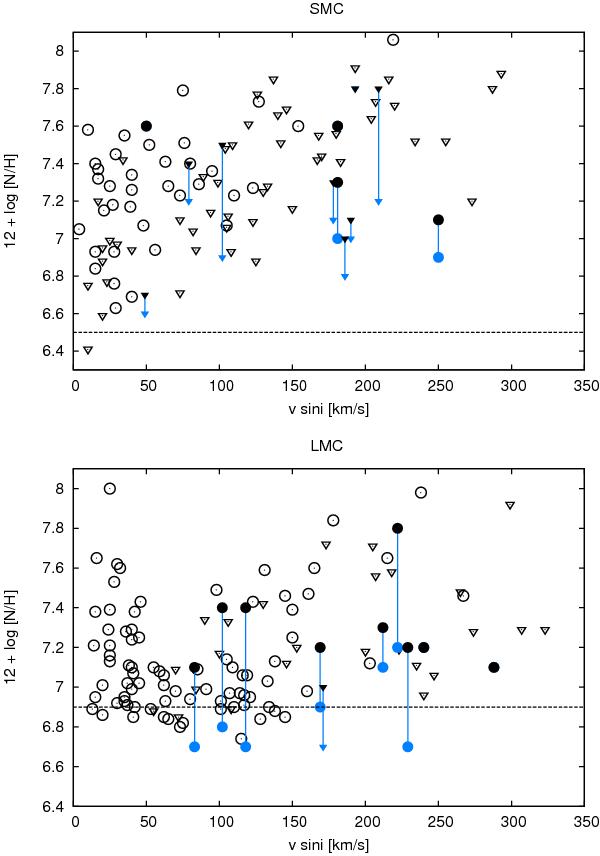
Comparison of Be-type stellar (black/blue) vsini and nitrogen abundances with those of B-type stars (black open circles) from Hunter et al. (2009a) for both metallicity regions analysed (SMC – upper panel, LMC – lower panel). Be-type star abundances are plotted for pre- (blue) and post-contamination (black) correction values. Upper limits are denoted with triangles.
Current usage metrics show cumulative count of Article Views (full-text article views including HTML views, PDF and ePub downloads, according to the available data) and Abstracts Views on Vision4Press platform.
Data correspond to usage on the plateform after 2015. The current usage metrics is available 48-96 hours after online publication and is updated daily on week days.
Initial download of the metrics may take a while.