Fig. 10
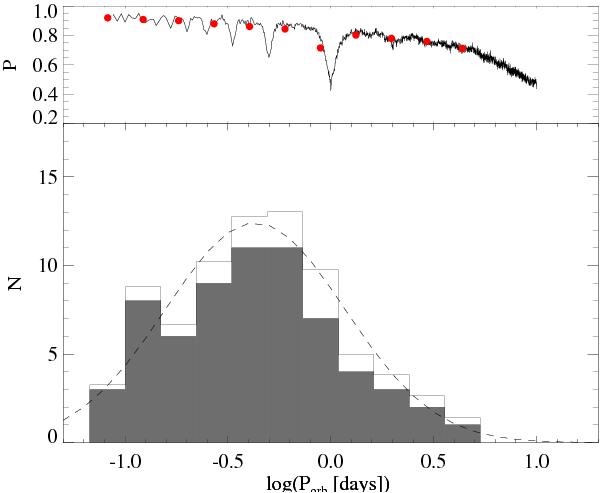
Orbital period distribution of the 65 SDSS PCEBs discovered in an homogeneous way through radial velocity variations measured in spectra spread over different nights (grey) and the bias-corrected distribution (white). The Gaussian fit to the bias-corrected distribution is plotted with a dashed line. In the upper panel we show the mean probability of detection as a function of the orbital period (see text) and the corresponding mean value at each bin centre (red dots).
Current usage metrics show cumulative count of Article Views (full-text article views including HTML views, PDF and ePub downloads, according to the available data) and Abstracts Views on Vision4Press platform.
Data correspond to usage on the plateform after 2015. The current usage metrics is available 48-96 hours after online publication and is updated daily on week days.
Initial download of the metrics may take a while.