Free Access
Fig. 9
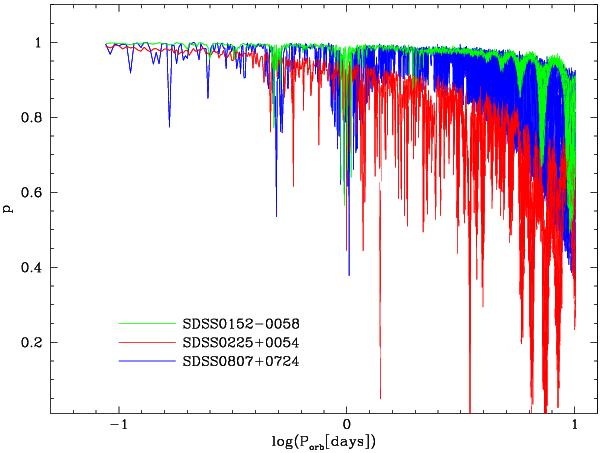
Detection probability for three cases corresponding to 2 spectra taken at the VLT (green), 6 spectra taken at the WHT, Magellan and SDSS (blue), and 16 spectra from the SDSS (red).
Current usage metrics show cumulative count of Article Views (full-text article views including HTML views, PDF and ePub downloads, according to the available data) and Abstracts Views on Vision4Press platform.
Data correspond to usage on the plateform after 2015. The current usage metrics is available 48-96 hours after online publication and is updated daily on week days.
Initial download of the metrics may take a while.