Free Access
Fig. 6
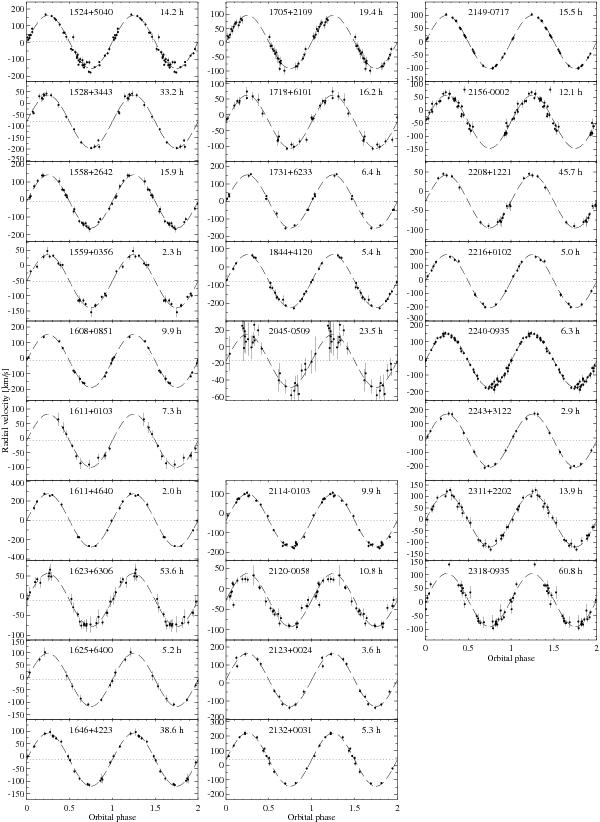
Phase-folded radial velocities curves and sine fits to the data (dashed lines). As for Fig. 3, systems are sorted in right ascension from left to right and from top to bottom.
Current usage metrics show cumulative count of Article Views (full-text article views including HTML views, PDF and ePub downloads, according to the available data) and Abstracts Views on Vision4Press platform.
Data correspond to usage on the plateform after 2015. The current usage metrics is available 48-96 hours after online publication and is updated daily on week days.
Initial download of the metrics may take a while.