Fig. 9
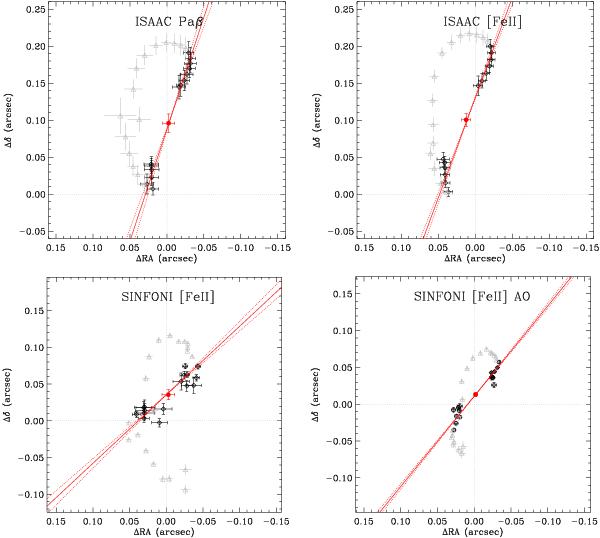
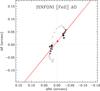
2D spectroastrometric map for the ISAAC longslit J band data (upper panels): Paβ line (upper left panel) and [Fe II] line (upper right panel). Spectroastrometric map for the SINFONI H band data (lower panels): [Fe II] line for the seeing limited observation (lower left panel) and AO assisted [Fe II] line (lower right panel). The red point marks the inferred BH position. The red solid line represents the line of nodes of the disk obtained with a linear fit of the HV points, as described in the text. The dotted red lines represent the 1σ uncertainties on the line of nodes position angle. All boxes have the same angular dimension on the plane of sky (~0.3″ × 0.3″).
Current usage metrics show cumulative count of Article Views (full-text article views including HTML views, PDF and ePub downloads, according to the available data) and Abstracts Views on Vision4Press platform.
Data correspond to usage on the plateform after 2015. The current usage metrics is available 48-96 hours after online publication and is updated daily on week days.
Initial download of the metrics may take a while.