Free Access
Fig. 5
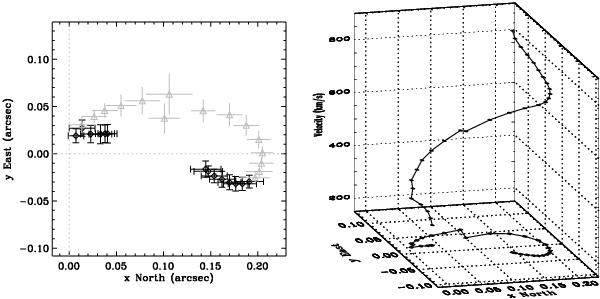
Spectroastrometric 2D map derived from the Paβ line (ISAAC spectra). Left panel: derived photocenter positions on the sky plane, the black points are those actually used for the minimization. Right panel: the 3D plot of the map, where the z axis is velocity.
Current usage metrics show cumulative count of Article Views (full-text article views including HTML views, PDF and ePub downloads, according to the available data) and Abstracts Views on Vision4Press platform.
Data correspond to usage on the plateform after 2015. The current usage metrics is available 48-96 hours after online publication and is updated daily on week days.
Initial download of the metrics may take a while.