Free Access
Fig. 22
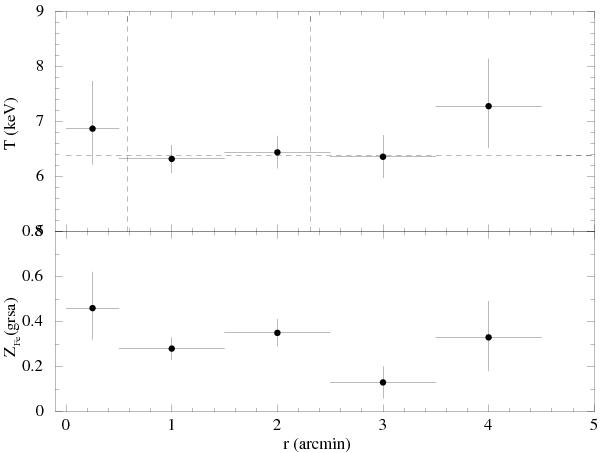
Profiles of the azimuthally averaged, projected temperature and metal abundances of A2254. The error bars are at the 68% c.l. The horizontal line shows the value of kTOUT, i.e. the value of kT estimated within the 0.05R180 < r < 0.2R180 region, with the two radii indicated by the two vertical lines.
Current usage metrics show cumulative count of Article Views (full-text article views including HTML views, PDF and ePub downloads, according to the available data) and Abstracts Views on Vision4Press platform.
Data correspond to usage on the plateform after 2015. The current usage metrics is available 48-96 hours after online publication and is updated daily on week days.
Initial download of the metrics may take a while.