Free Access
Fig. 21
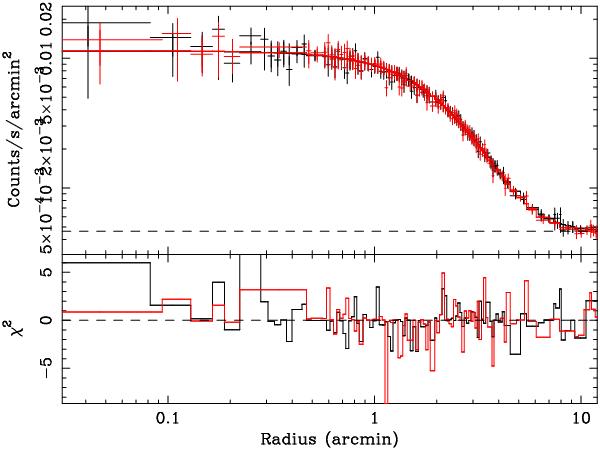
Surface brightness profile of the X-ray emission of A2254. Data from MOS1 are plotted in black and from MOS2 in red. The best-fit β-model and ratio of data over the model are also shown. The background level is shown as the black dashed line in the lower panel.
Current usage metrics show cumulative count of Article Views (full-text article views including HTML views, PDF and ePub downloads, according to the available data) and Abstracts Views on Vision4Press platform.
Data correspond to usage on the plateform after 2015. The current usage metrics is available 48-96 hours after online publication and is updated daily on week days.
Initial download of the metrics may take a while.