Free Access
Fig. 20
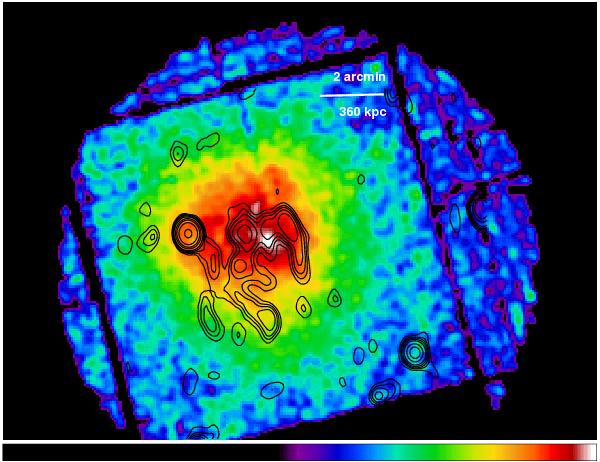
X-ray image of the diffuse emission of the A2254 cluster where point sources were removed and replaced by a local estimate of the surrounding emission and only regions exposed by more than 65% of the maximum exposure is considered. The contour levels of the radio VLA image (Govoni et al. 2001b) are superimposed, too.
Current usage metrics show cumulative count of Article Views (full-text article views including HTML views, PDF and ePub downloads, according to the available data) and Abstracts Views on Vision4Press platform.
Data correspond to usage on the plateform after 2015. The current usage metrics is available 48-96 hours after online publication and is updated daily on week days.
Initial download of the metrics may take a while.