Fig. 18
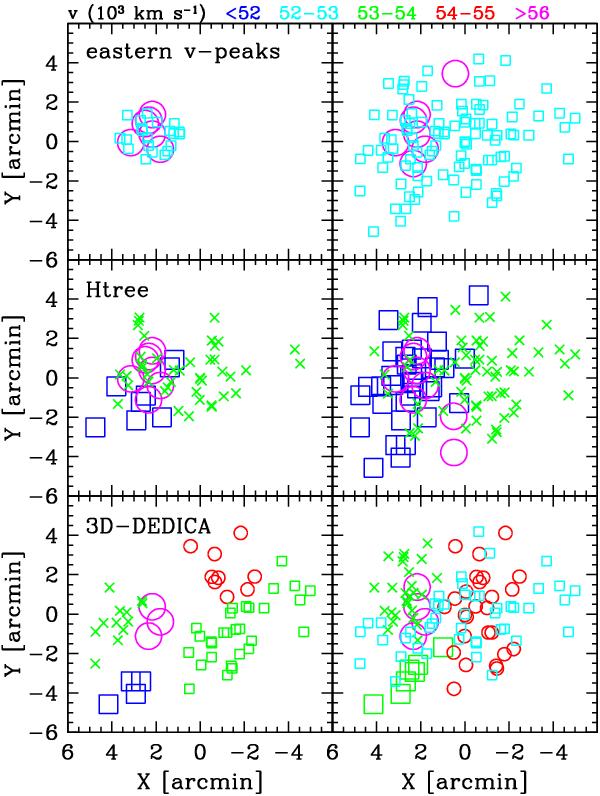
Spatial distribution on the sky of the galaxies for the subclusters detected by our 3D analysis and the cluster partitions obtained through the 3D-KMM method using them as seeds (left and right panels, respectively). In the left panels symbols refer to different groups. The different colors refer to different mean velocities according to the legend at the top of the figure. In the right panels symbols indicate subclusters found using the respective groups on the left as seeds, and colors refer again to the velocity according to the above legend.
Current usage metrics show cumulative count of Article Views (full-text article views including HTML views, PDF and ePub downloads, according to the available data) and Abstracts Views on Vision4Press platform.
Data correspond to usage on the plateform after 2015. The current usage metrics is available 48-96 hours after online publication and is updated daily on week days.
Initial download of the metrics may take a while.