Fig. 16
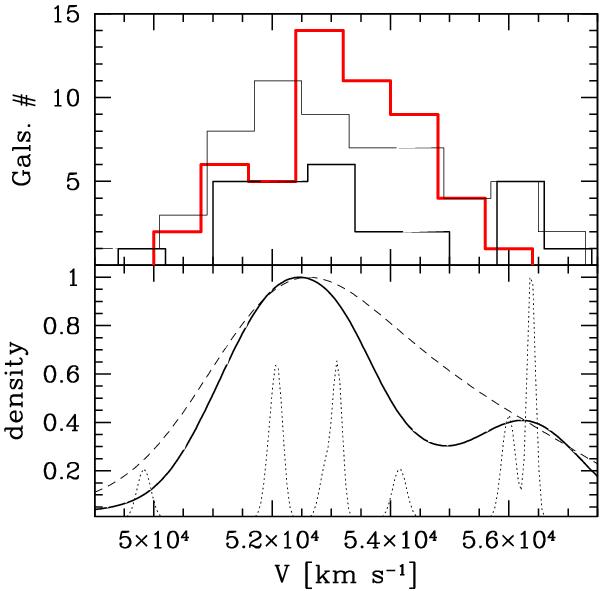
Upper panel: velocity distributions of the galaxies in the western and eastern samples (thick/red and thin/black lines, respectively). The velocity distribution of a subsample of the eastern sample, i.e. the 27 galaxies within a radius of 1.5′from the E peak (E1.5 sample), is also shown (black thick line). Lower panel: the galaxy density distribution in the velocity space, as provided by the DEDICA adaptive-kernel reconstruction method for the E1.5 sample (solid line) and for two samples contained within a larger and a smaller radius, E2.0 and E1.0 samples (dashed and dotted lines, respectively). Units on the y-axis are normalized to the density of the highest peak.
Current usage metrics show cumulative count of Article Views (full-text article views including HTML views, PDF and ePub downloads, according to the available data) and Abstracts Views on Vision4Press platform.
Data correspond to usage on the plateform after 2015. The current usage metrics is available 48-96 hours after online publication and is updated daily on week days.
Initial download of the metrics may take a while.