Fig. 15
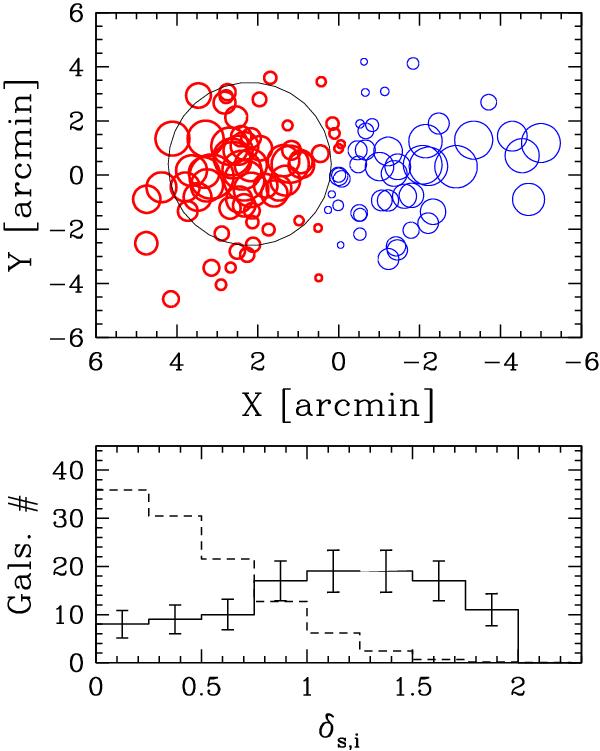
Upper panel: the same as Fig. 14 – lower panel but for the DS-test with a larger number of neighbors (Nnn = 40). The large faint circle encloses the region within 1.5′from the E peak: galaxies inside define the E1.5 sample. Lower panel: the distribution of δs,i deviations in the above DS-test. The solid line represents the observations, the dashed line the distribution for the galaxies of the 1000 simulated clusters, normalized to the observed number.
Current usage metrics show cumulative count of Article Views (full-text article views including HTML views, PDF and ePub downloads, according to the available data) and Abstracts Views on Vision4Press platform.
Data correspond to usage on the plateform after 2015. The current usage metrics is available 48-96 hours after online publication and is updated daily on week days.
Initial download of the metrics may take a while.