Fig. 9
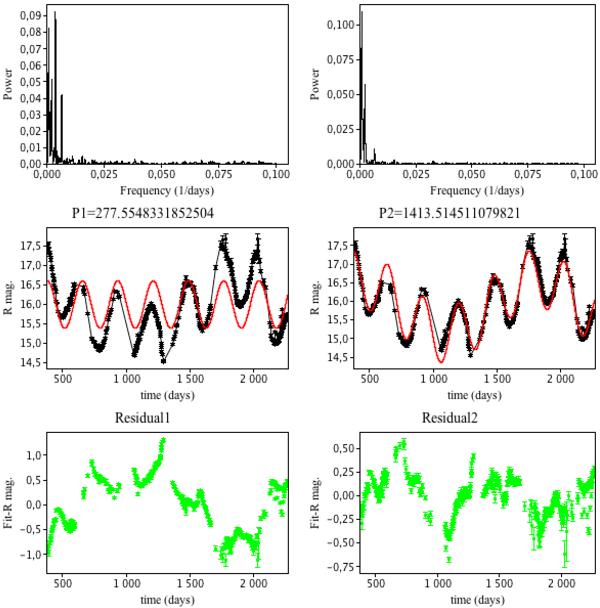
Period search example for star lm0024n4304. The top panels show the successive power spectra of the raw light curve (left panel) and of the first residual (right panel). The middle panels display the light curve in R band (black points with error bars), with the fitted Fourier series superimposed (red curve) for the first (left panel) and first and second (right panel) periods found. The bottom panels show the residuals after subtraction of the fits from the light curve.
Current usage metrics show cumulative count of Article Views (full-text article views including HTML views, PDF and ePub downloads, according to the available data) and Abstracts Views on Vision4Press platform.
Data correspond to usage on the plateform after 2015. The current usage metrics is available 48-96 hours after online publication and is updated daily on week days.
Initial download of the metrics may take a while.