Free Access
Fig. 7
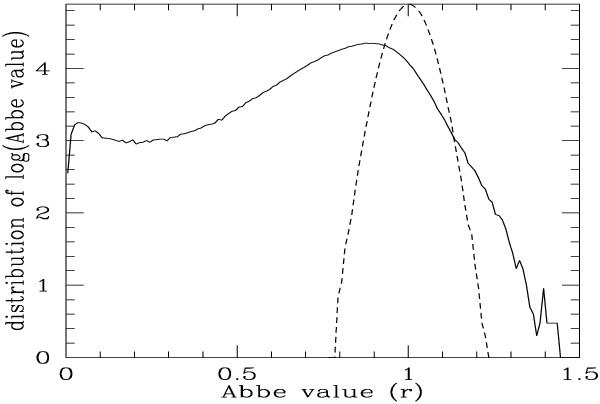
Distribution of the Abbe statistic for a cleaned time series of all LMC variable stars (solid line). The dashed line shows the expected distribution of the Abbe values for simulated time series with normally distributed magnitudes.
Current usage metrics show cumulative count of Article Views (full-text article views including HTML views, PDF and ePub downloads, according to the available data) and Abstracts Views on Vision4Press platform.
Data correspond to usage on the plateform after 2015. The current usage metrics is available 48-96 hours after online publication and is updated daily on week days.
Initial download of the metrics may take a while.