Fig. 28
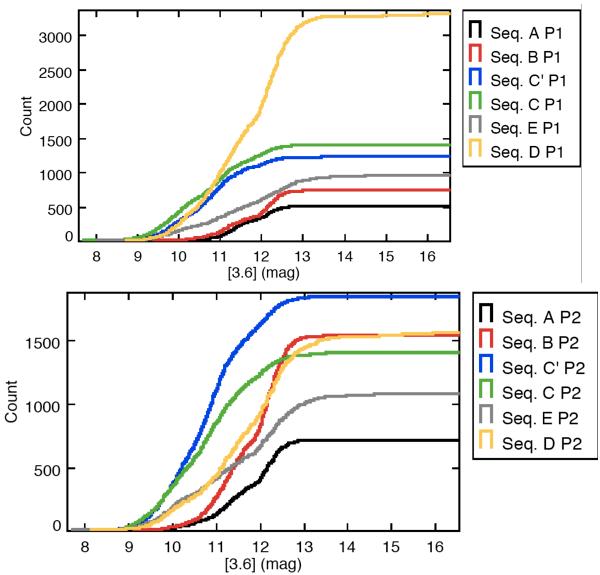
Cumulative distribution for double-periodic LPVs for the sequences in Fig. 25. Each line represents a sequence, which are, from the most populated (top line at [3.6] = 16.5 mag) to the less populated (bottom line at [3.6] = 16.5 mag): for the first period (top panel): Seq. D, Seq. C, Seq. C′, Seq. E, Seq. B, Seq. A. For the second period (bottom panel): Seq. C′, Seq. D, Seq. B, Seq. C, Seq. E, Seq. A.
Current usage metrics show cumulative count of Article Views (full-text article views including HTML views, PDF and ePub downloads, according to the available data) and Abstracts Views on Vision4Press platform.
Data correspond to usage on the plateform after 2015. The current usage metrics is available 48-96 hours after online publication and is updated daily on week days.
Initial download of the metrics may take a while.