Free Access
Fig. 15
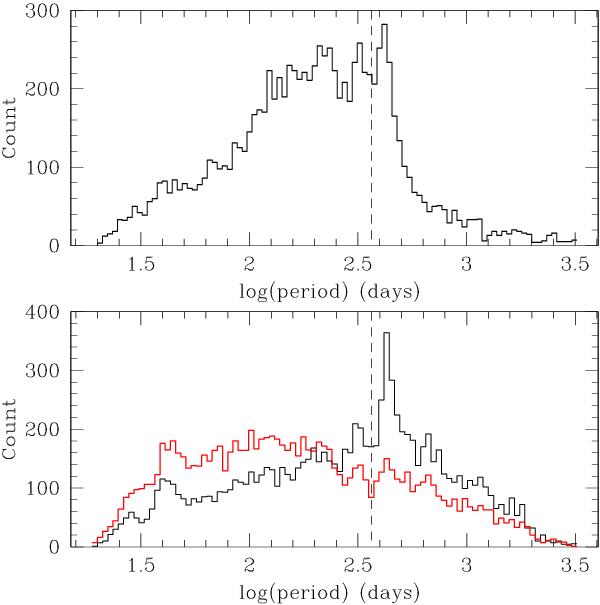
Top panel: histogram of the periods for mono-periodic LPVs, on a log scale. Bottom panel: histogram of the periods for double-periodic LPVs, on a log scale. The black line is for the first periods found, the red one is for the second periods found. Vertical dashed lines at log P = 2.56 indicate the period at one year.
This figure is made of several images, please see below:
Current usage metrics show cumulative count of Article Views (full-text article views including HTML views, PDF and ePub downloads, according to the available data) and Abstracts Views on Vision4Press platform.
Data correspond to usage on the plateform after 2015. The current usage metrics is available 48-96 hours after online publication and is updated daily on week days.
Initial download of the metrics may take a while.