Free Access
Fig. 13
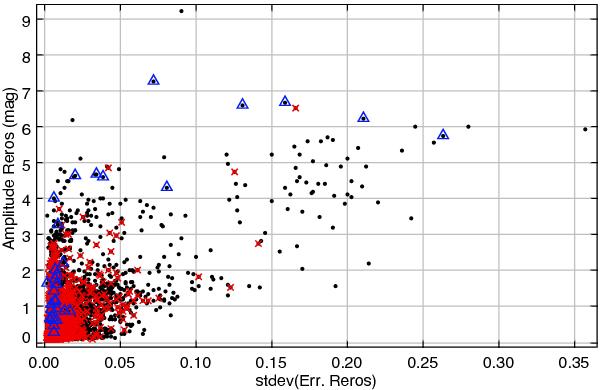
Peak-to-peak amplitude versus the standard deviation in the error values. Stars without any period simultaneously found with the three-period search methods, are shown as black points. Red crosses are stars showed in Fig. 12. Blue triangles are RCB and DY PER identified by Tisserand et al. (2009).
Current usage metrics show cumulative count of Article Views (full-text article views including HTML views, PDF and ePub downloads, according to the available data) and Abstracts Views on Vision4Press platform.
Data correspond to usage on the plateform after 2015. The current usage metrics is available 48-96 hours after online publication and is updated daily on week days.
Initial download of the metrics may take a while.