Fig. 1
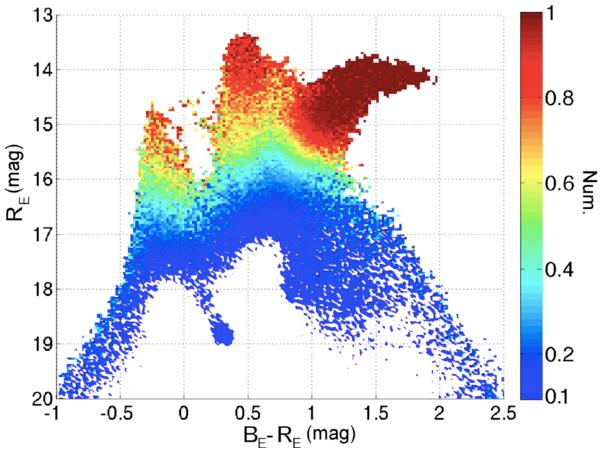
EROS-2 (BE − RE, RE) color − magnitude diagram of the ratio of the number of variable stars to the total number of stars. The color − magnitude diagram is divided into a matrix of 250 × 250 bins, each bin being 0.014 × 0.028 mag wide. The ratio is plotted according to a color-scale shown on the right of the figure. Only bins with at least ten stars and a ratio above 0.1 are plotted. Color version of the figures in this paper are available in the online version.
Current usage metrics show cumulative count of Article Views (full-text article views including HTML views, PDF and ePub downloads, according to the available data) and Abstracts Views on Vision4Press platform.
Data correspond to usage on the plateform after 2015. The current usage metrics is available 48-96 hours after online publication and is updated daily on week days.
Initial download of the metrics may take a while.