Fig. 6
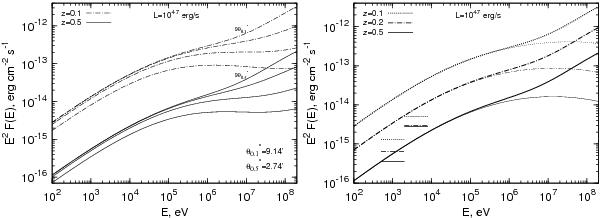
Energy flux distribution of gamma- and X-rays observed within different angles in the direction of the source (left panel) and within maximum angle (right panel) for a two-band magnetic field. For the right panel, the total radiation from photomeson and pair production electrons (upper lines) and the radiation from pair production electrons (lower lines) are indicated. Horizontal segments present the Chandra sensitivity for the corresponding maximum angles of observation. The other parameters are the same as in previous figures.
Current usage metrics show cumulative count of Article Views (full-text article views including HTML views, PDF and ePub downloads, according to the available data) and Abstracts Views on Vision4Press platform.
Data correspond to usage on the plateform after 2015. The current usage metrics is available 48-96 hours after online publication and is updated daily on week days.
Initial download of the metrics may take a while.