Fig. 15
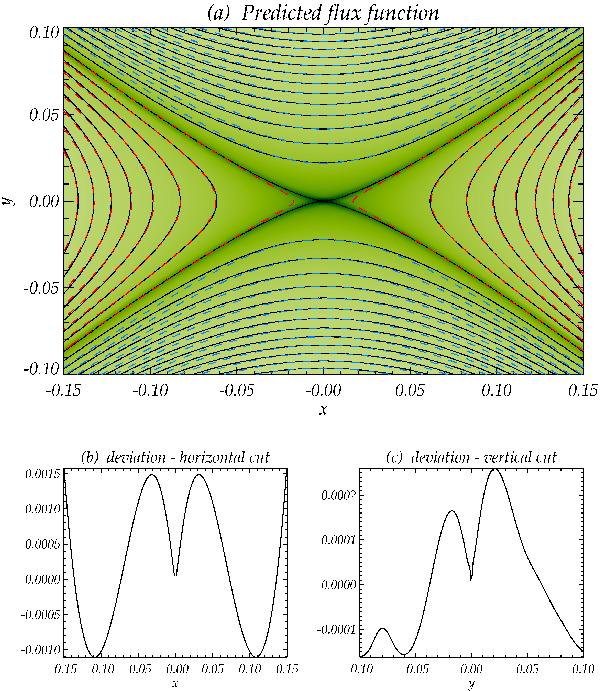
Analytical prediction of the flux function, compared to numerical equilibrium state, for the experiment with h = 0.7 and p0 = 0.375. In a) we show the numerical magnetic field lines (solid black) over a contour map of the current density, with the analytical contours of Az for inside the cusp (red dashed) and outside the cusp (blue dashed). In b) and c) we show the relative error of the analytical prediction from the numerical state for a horizontal cut (inside cusp) and a vertical cut (outside cusp) respectively.
Current usage metrics show cumulative count of Article Views (full-text article views including HTML views, PDF and ePub downloads, according to the available data) and Abstracts Views on Vision4Press platform.
Data correspond to usage on the plateform after 2015. The current usage metrics is available 48-96 hours after online publication and is updated daily on week days.
Initial download of the metrics may take a while.