Fig. 14
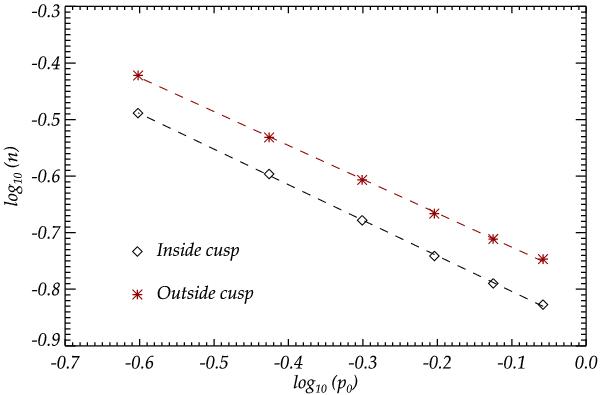
Logarithmic plot of the exponent n for both regions inside and outside the cusp, as a function of the initial pressure, for a set of six experiments with the same squashing h = 0.7, after the same time has elapsed. The exponents follow a power law with a very similar decay rate for the two regions. The slopes are − 0.63 and − 0.6 respectively for inside and outside the cusp.
Current usage metrics show cumulative count of Article Views (full-text article views including HTML views, PDF and ePub downloads, according to the available data) and Abstracts Views on Vision4Press platform.
Data correspond to usage on the plateform after 2015. The current usage metrics is available 48-96 hours after online publication and is updated daily on week days.
Initial download of the metrics may take a while.