Fig. 13
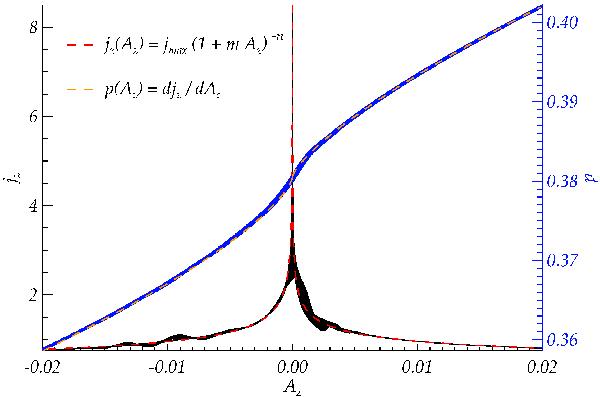
Test of Grad-Shafranov condition for the experiment with h = 0.7 and p0 = 0.375. Current density (black, y-axis on the left) and plasma pressure (blue, y-axis on the right) are plotted against the flux function Az, for every single point in the numerical domain. Positive values of Az refer to inside of the cusp, while negative Az are outside the cusp. The functional form jz(Az) = jmax(1 + mAz) − n is overplotted here.
Current usage metrics show cumulative count of Article Views (full-text article views including HTML views, PDF and ePub downloads, according to the available data) and Abstracts Views on Vision4Press platform.
Data correspond to usage on the plateform after 2015. The current usage metrics is available 48-96 hours after online publication and is updated daily on week days.
Initial download of the metrics may take a while.