Fig. 4
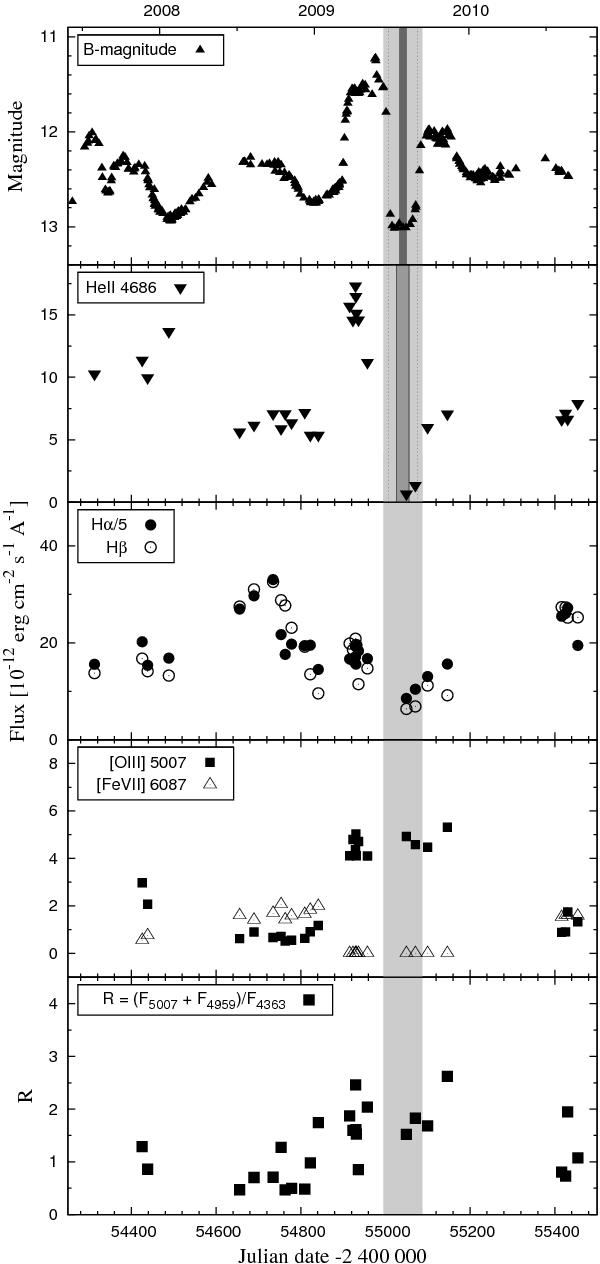
Variation in the selected line fluxes during the 2007–10 active phase. Top panel shows the B-band LC to compare variation in the continuum and to visualize better the time-interval of the eclipse (the light shadow band). The width of the dark and mild shadow band corresponds to the linear size of the eclipsed object and the He + + zone, respectively. Dotted lines limit the radius of the cool giant. Fluxes are dereddened and their values are given in Table 5.
Current usage metrics show cumulative count of Article Views (full-text article views including HTML views, PDF and ePub downloads, according to the available data) and Abstracts Views on Vision4Press platform.
Data correspond to usage on the plateform after 2015. The current usage metrics is available 48-96 hours after online publication and is updated daily on week days.
Initial download of the metrics may take a while.