Fig. 1
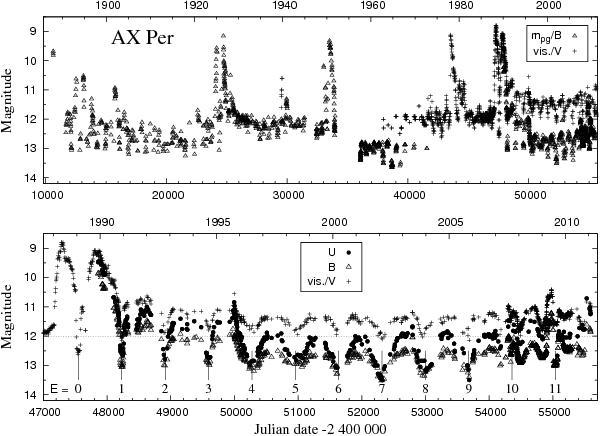
Top panel displays the historical LC of AX Per from ~1890 (see Fig. 1 of Skopal et al. 2001,and references therein). We used visual magnitude estimates from the AAVSO International Database and those gathered by members of the AFOEV, which are available on CDS. Visual data were smoothed within 20-day bins. Bottom panel shows the UBV LCs of AX Per from its last 1988 major outburst. Minima timing corresponds to the ephemeris given by Eq. (1).
Current usage metrics show cumulative count of Article Views (full-text article views including HTML views, PDF and ePub downloads, according to the available data) and Abstracts Views on Vision4Press platform.
Data correspond to usage on the plateform after 2015. The current usage metrics is available 48-96 hours after online publication and is updated daily on week days.
Initial download of the metrics may take a while.