Fig. 5
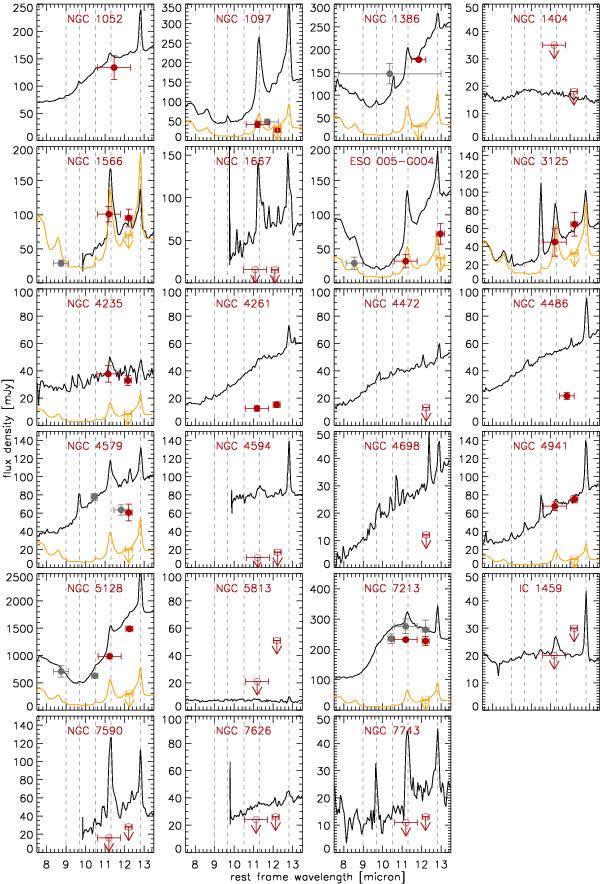
Comparison of VISIR photometry (red symbols: P83 data, gray symbols: re-reduced data from the archive) and Spitzer IRS spectra (black line). In addition, photometric measurements in the narrow-N filter for NGC 1097 (Mason et al. 2007), and the Si2 filter for NGC 1386 and NGC 5128 and in the N filter for NGC 1386 are also plotted in gray for comparison (Ramos Almeida et al. 2009). Horizontal error bars correspond to the filter pass band. The IRS spectra of NGC 1566, NGC 4594, NGC 1667, NGC 7590, and NGC 7626 are smoothed for better visibility. Common emission lines are indicated by the dotted lines. We used the redshifts from the NED database for the rest frame wavelengths. In addition, the scaled starburst template SED (displayed as orange line) are shown as well as the derived upper limit for the starburst contribution to the continuum filter measurement (orange symbols), see Sect. 5.3 for details.
Current usage metrics show cumulative count of Article Views (full-text article views including HTML views, PDF and ePub downloads, according to the available data) and Abstracts Views on Vision4Press platform.
Data correspond to usage on the plateform after 2015. The current usage metrics is available 48-96 hours after online publication and is updated daily on week days.
Initial download of the metrics may take a while.