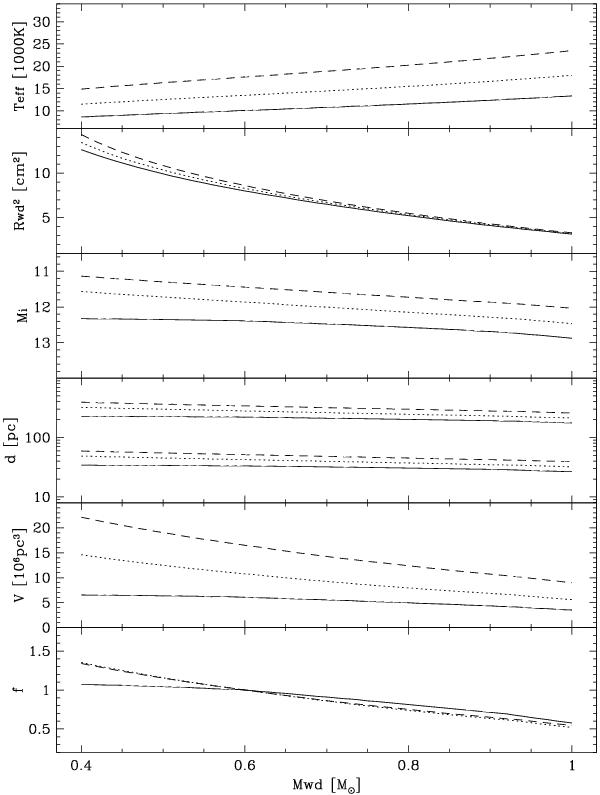
Fig. 2

The probability of identifying CVs within SDSS if their optical emission is dominated by the luminosity of the accretion-heated WD as a function of Mwd. From top to bottom: the effective temperature calculated using Eq. (1) in Townsley & Gänsicke (2009); Rwd2; the absolute i-band magnitude; the minimum and maximum distance at which SDSS will have obtained follow-up spectroscopy; the effective survey volume for a spherical cap with b > 30°, Hz = 200 pc, and dmin < d < dmax, and the relative probability normalized to Mwd = 0.6 M⊙. Three secular mean accretion rates are shown, ⟨ Ṁ ⟩ = 3 × 10-11 M⊙ yr-1 (solid lines), 10-10 M⊙ yr-1 (dotted lines), and 3 × 10⁻¹⁰ M⊙ yr-1 (dashed lines).
Current usage metrics show cumulative count of Article Views (full-text article views including HTML views, PDF and ePub downloads, according to the available data) and Abstracts Views on Vision4Press platform.
Data correspond to usage on the plateform after 2015. The current usage metrics is available 48-96 hours after online publication and is updated daily on week days.
Initial download of the metrics may take a while.


