Fig. A.1
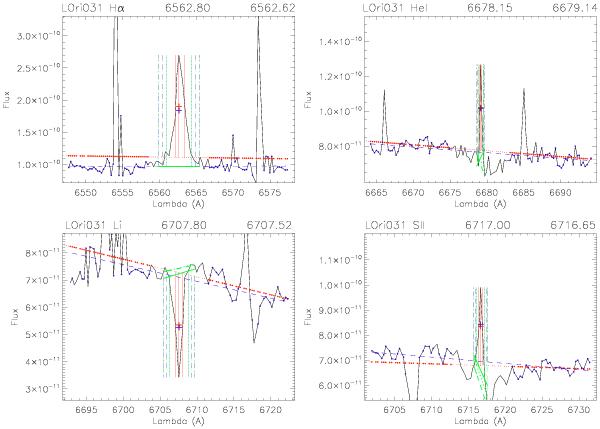
Example of the output of the code designed to measure EW, FWHM, and FW10% of the different lines detected on the spectra in an automatic manner. In this case, we show four of the measured lines in the average MIKE spectra obtained for LOri031: Hα at 6562.80 Å, He I at 6678.15 Å, Li I at 6707.8 Å, and S II at 6717.0 Å. For each case, the canonical wavelength for the measured line and the actual wavelength where the line has been found in our spectra are displayed as the title of the plot (all of them within the errors in the wavelength calibration). The iterative process in the continuum determination is displayed using different colors: red for the first iteration (including the first guess for the half maximum flux value, red cross), blue for the second one (filled blue dots on the data-points used to refine the first continuum, blue cross showing the second half maximum estimation), and the three green lines (filled, dotted and dashed) representing the final determined continuum.
Current usage metrics show cumulative count of Article Views (full-text article views including HTML views, PDF and ePub downloads, according to the available data) and Abstracts Views on Vision4Press platform.
Data correspond to usage on the plateform after 2015. The current usage metrics is available 48-96 hours after online publication and is updated daily on week days.
Initial download of the metrics may take a while.