Fig. 13
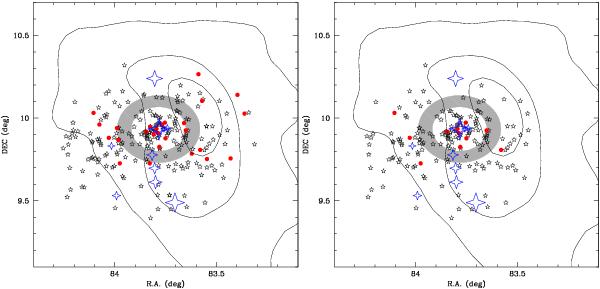
Spatial distribution of in the left panel good photometric candidates and right panel spectroscopically confirmed members. The O and B populations are highlighted with large blue (four pointed) stars, members with masses above the H burning limit are displayed as small black (five pointed) stars, and brown dwarfs are indicated as filled red dots. In both figures, it is clear that brown dwarfs are not located at the edges of the cluster (as the ejection mechanism would predict). We have shaded in grey the ring corresponding to the void in the radial profile displayed on Fig. 14.
Current usage metrics show cumulative count of Article Views (full-text article views including HTML views, PDF and ePub downloads, according to the available data) and Abstracts Views on Vision4Press platform.
Data correspond to usage on the plateform after 2015. The current usage metrics is available 48-96 hours after online publication and is updated daily on week days.
Initial download of the metrics may take a while.