Fig. 1
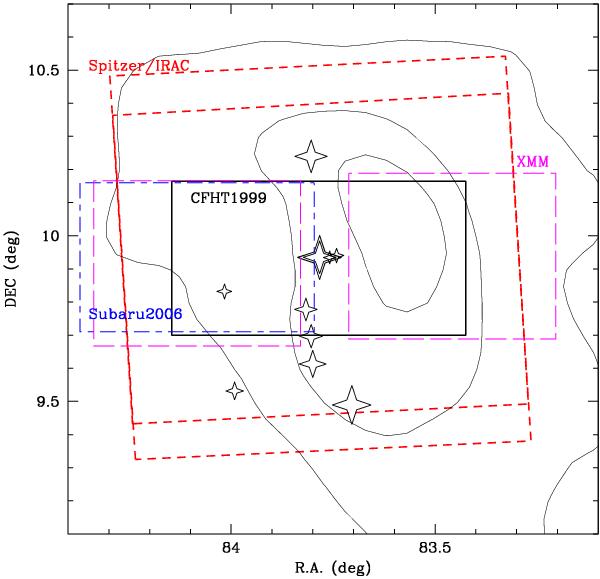
Sketch of the areas covered by the main optical, infrared, and X-ray surveys in the region of Collinder 69. λ Ori itself is highlighted with a large star and the B population with smaller ones. Omega 2000 and Ingrid data together fill the area covered by the CFHT survey (we do not include the mosaics for the sake of clarity in the figure). The large red dashed boxes show the IRAC FoV – the edges are the regions with coverage only in 3.6/5.8 or 4.5/8.0 – and the area surveyed by MIPS is slightly larger.
Current usage metrics show cumulative count of Article Views (full-text article views including HTML views, PDF and ePub downloads, according to the available data) and Abstracts Views on Vision4Press platform.
Data correspond to usage on the plateform after 2015. The current usage metrics is available 48-96 hours after online publication and is updated daily on week days.
Initial download of the metrics may take a while.